Business Intelligence and Data Analytics
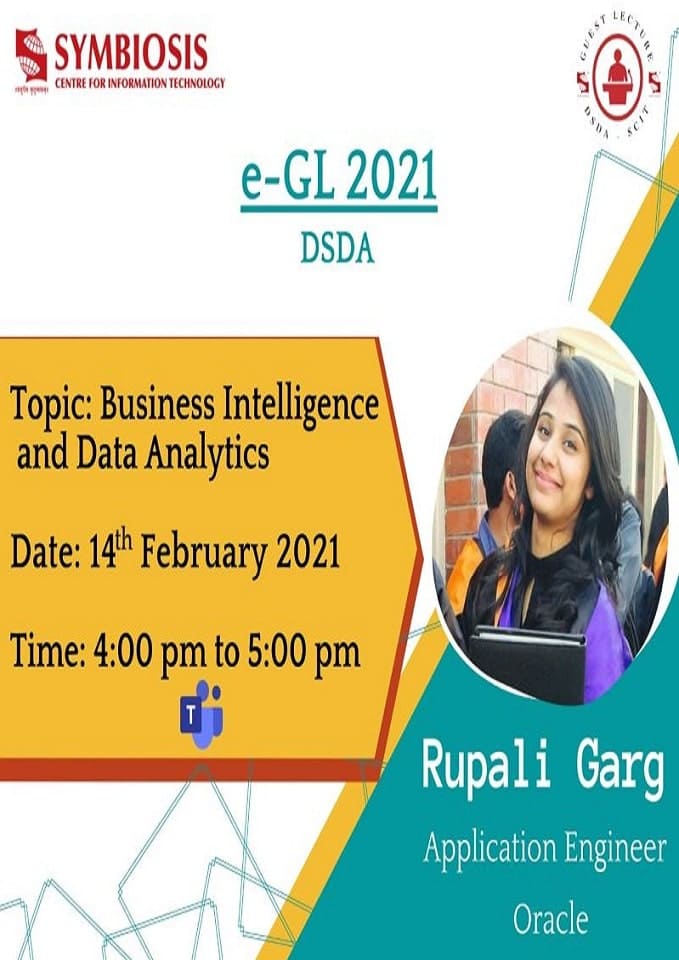
Over the last decade, Business Intelligence has been consistently listed amongst the top technology projects for organisations. On 14th February, 2021 there was an e- GL by speaker Rupali Garg working as an application engineer at Oracle. She explained the importance of BI and analytics for enterprises of all sizes.
Business intelligence is the processes, technologies, and tools that helps change data into insights. Data is raw value elements for reasoning or calculating. Collecting and organising data in such a way that establishes relationship between data items is called as information. The concept of understanding information based on recognise patterns in a way that provides insights to information is called as knowledge. The insights gathered turns into plan which then guides the organisations.
BI technologies are used for gathering, storing, analysing and providing access to data to help enterprise users make better business decisions. In patient experience analysis, the patient waiting time can be reduced by identifying which departments needed to hire more doctors. KPI, charts helps to know what happened in the past through historical data to discover relevant patterns for making strategic decisions in the future. By looking at charts, risks can be identified and also for realising how realistic the expectations are.
The speaker briefed about Data Warehouse which is a central location where consolidated subject oriented, integrated, time-variant and non-volatile collection of data from multiple locations are stored. The data is stored as series of snapshots, each present in a period of time and typically data in the data warehouse is not updated or deleted. It does not have real time data. The data on a given subject is collected from separate sources. It is then categorised and stored by business objects rather than by application and stored in a single place. It is maintained separately from an organisations operational database. The end users access it whenever any information is needed. After analysing the business requirements multiple data sources integrated in data warehouse can help estimate schedule, scope, costs and return on investment (ROI). She further threw some light on Data warehouse architecture. The smaller version of Data warehouse is Data Mart. It is department wide data with limited data sources, limited occupied memory and focused on one area. The speaker then explained different data marts types like dependent data mart, independent data mart and hybrid data mart.
The speaker explained the difference between regional database (Online Transaction Processing) and analytical data warehouse (Online Analytical Processing). OLAP is based on Star, Snowflake and Fact Constellation Schema meanwhile OLTP is based on Entity Relationship Model. OLTP contains current data, like all bank transactions made by a person. Whereas OLAP contains historical data like transactions at a particular time. The Data size of OLAP is huge(100 GB – 1TB) as old data is maintained continuously in addition to the old data as comparison with OLTP (100 MB – 1 GB). OLAP is used to make complicated analysis of multidimensional data whereas OLTP systems use data stored in the form of two-dimensional tables with rows and columns. SSAS is a OLAP tool by Microsoft.
It was a very insightful lecture where the students got to learn many new things about BI tools and techniques. The session ended with question and answers.


