Introduction to Data Visualisation in Python

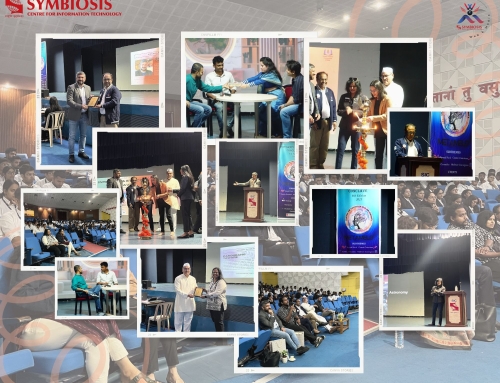
With the partial moving to the college campus, the excitement and zeal were infectious. Amidst all these a guest lectures were organized on Data Visualisation in Python. The speaker invited to deliver was Mr. Sanchit Balchandani. He is a senior Python developer having 10 years of IT experience. He has worked in multiple domains like – healthcare, ad-tech, infrastructure, and automation. Majorly, he has been working in the backend side of the systems and also later on SRE(DevOps). He is very passionate about Community Building, Python & Infrastructure. He strongly believes in the power of community and spends his free time contributing towards some open source communities like HydPy & DSUG Hyd.
The session commenced with Mr. Balchandani introducing himself on the work fronts and delved into python. He explained what data visualization is and how important it is to deal with data and get insights of data and analyze it i.e. handling of data.
He walked us through the Jupyter notebook which is essentially an online interpreter where one can run python code and visualize the data. It is an open-source web application that allows to create and share of documents that contain live code, equations, visualizations, and narrative text. Uses include data cleaning and transformation, numerical simulation, statistical modeling, data visualization, machine learning, and much more. It supports over 40 programming languages. One can Share notebooks. Notebooks can be shared with others using email, Dropbox, GitHub. Additionally, it also leverages big data tools, such as Apache Spark, from Python, R, and Scala.
Next, he talked about Pandas, which is a fast, powerful, flexible, and easy-to-use open-source data analysis and manipulation tool, built on top of the Python programming language. It is the best tool for beginners who are starting on the journey to master the language. It also works with Big Data which helps it to work with large excel files which otherwise is difficult to manage. It is commonly known as Pd.
He went ahead and elucidated many different tools and with hands-on explained the functions and how to use and navigate them. He emphasized how one can modify the data. He shed some light upon some different libraries like mat plot lib, numpy, etc. to process the data easily and optimize the code for faster processing as arrays are provided.
In the later part of the lecture, he answered some questions which students raised. All in all the session was very informative and it had boosted the confidence of the budding programmers and analysts.