Computational Techniques for Visual Analysis of Communication data

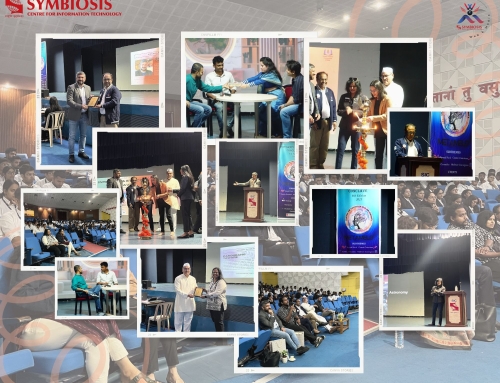
SCIT organized a session on Computational techniques for visual analysis of communication data. The session was held by Dr. Daniel Angus, School of Communication & Arts, University of Queensland. He started with the need arising today in making sense out of communication data derived out of either human to human or machine interactions. With majority of unstructured and structured data being text, the rate of expansion has been outpacing our capacity to make sense of it. Over the years, this has been prevalent in the content generated in social media, including blogs, websites and discussion forums.
Visual analytics accounts for the content generated out of the corporate databases, micro-blog feeds and newspaper articles ‘clipping’ to name a few. The outcome is to generate visual representations and metric information for analysis. Dr. Angus took up for discussion of two tools used for visual analytics, namely, Leximancer and Discursis. Leximancer, a soft tool for analyzing natural language data in a text, extracts semantic (meaning) and relational information, by understanding how they are related. It often is understood that repeated collocation implied that a relationship existed between those terms. He also stressed on the data integrity, which is an essential part.
The whole exercise of the tool, according him, was to establish the strength of relationship between two concepts or words. Later he also took upon another tool, Discursis, which focussed primarily on the temporal data. He said that the unit is measured often by determining the nature of text input. Dr. Angus explained the concept by taking upon an example of conversation between a doctor and a patient and helped the students understand better. Thereby, he could differentiate between the efficacies of a good and a bad conversation using a Discursis plot.
A coal seam gas case study was also discussed; where the forum was open for discussion. Many students participated and engaged themselves in interpreting the results. He displayed a few sample concept maps by demonstrating a short hands-on with both the tools, with which he generated insights, clearing doubts for many students. It was an overall interesting session that gave students a platform to venture into a new level of analytics.